Electric transport is moving from pilot projects to everyday infrastructure. The International Energy Agency’s Global EV Outlook 2024 reports that the worldwide public charging network exceeded four million points in 2023. Public fast-charging capacity also expanded rapidly, especially along highways and in dense urban areas. These figures reveal strong demand for reliable DC equipment.
This article examines the Top 10 DC Fast Charger Station Manufacturers Worldwide. It compares charging power, operating reliability, connector support, software integration, safety engineering, and international deployment experience. A modern DC Fast Charger station may deliver 60 kW at a city site or more than 350 kW on a major travel corridor. Real performance depends on grid capacity, battery temperature, cable design, and site management.
Independent evidence matters here. The IEA provides global market context, while BloombergNEF’s Electric Vehicle Outlook tracks adoption, investment, and charging trends. IEC standards and Open Charge Point Protocol practices also help assess technical compatibility. Manufacturer claims alone are not enough. Field uptime, service response, warranty terms, and long-term maintenance deserve equal attention.
No ranking is perfect. Public data can be incomplete.
Some manufacturers publish detailed reliability figures, while others disclose little beyond peak output. That difference can influence comparisons. A powerful charger is not automatically the best choice if users face payment failures, broken connectors, or long repair delays. Therefore, this overview combines documented capabilities with practical industry considerations, helping fleet operators, investors, retailers, and charging-site developers identify manufacturers with credible global reach and usable technology.
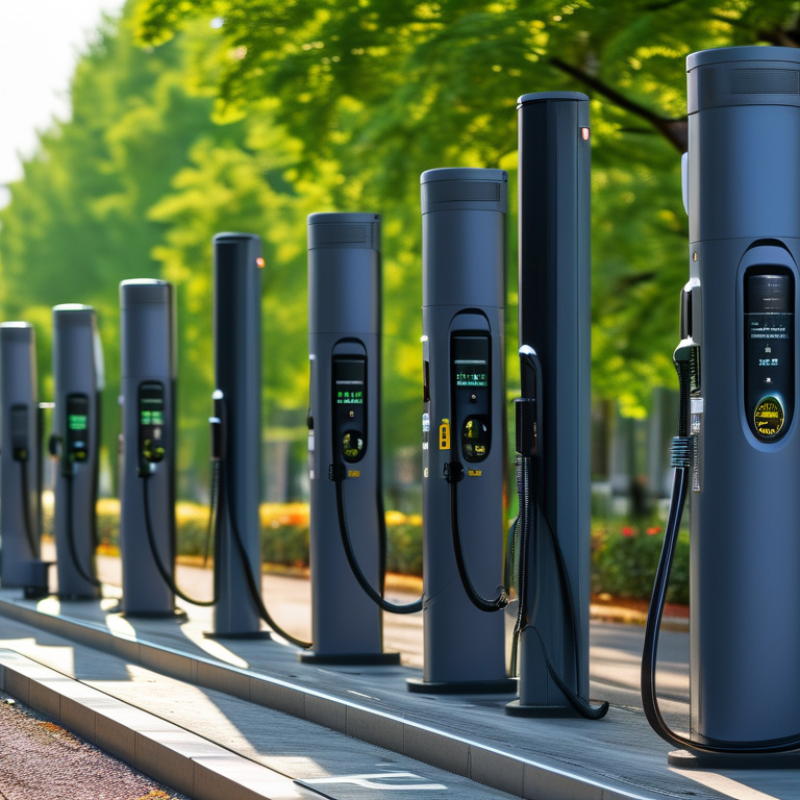
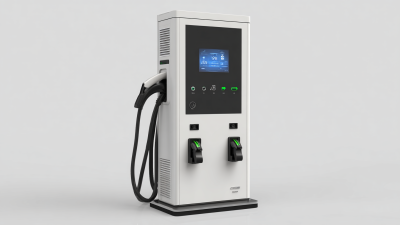
DC fast chargers deliver direct current to an EV battery, avoiding the vehicle’s slower onboard AC converter. This design supports rapid energy transfer, commonly from 50 kW to 350 kW. Charging time still depends on battery temperature, state of charge, and vehicle limits. Power alone does not guarantee speed.
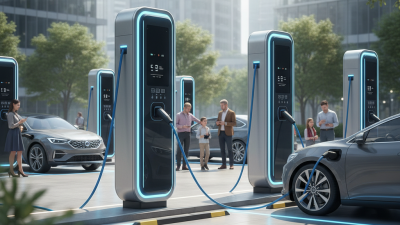
The International Energy Agency reported more than four million public charging points worldwide at the end of 2023. It also recorded rapid growth in high-power installations, especially along highways and in urban corridors. These stations reduce long-distance travel friction by placing visible electrical capacity near fuel stations, workplaces, and retail areas. A ten-minute stop can add meaningful range.
Station manufacturers therefore influence more than hardware output. They must manage thermal control, payment systems, network uptime, accessibility, and safe communication with vehicles. The National Renewable Energy Laboratory highlights reliability and charger utilization as major infrastructure concerns. Poor maintenance can turn a powerful unit into expensive street furniture.
The numbers need careful reading. Public charger totals do not reveal whether every connector works during peak demand. The IEA also notes uneven deployment between regions, while grid connection delays can slow new projects. This is where industry rankings become imperfect. A manufacturer with many installed units may not deliver the best local experience. Real performance requires transparent uptime data, verified field testing, and regular maintenance records.
Ranking the world’s DC fast charger manufacturers requires more than comparing advertised charging speeds. A credible assessment begins with verified output, charging-curve stability, and performance across different battery conditions. Laboratory tests should measure power delivery at low temperatures, high temperatures, and near-full battery levels. Real uptime matters. Independent service records can reveal failures that brochures rarely mention.
Safety and compatibility deserve equal weight. Evaluators should examine electrical protection, thermal management, connector durability, and compliance with recognized international standards. Software quality also affects daily operations. Useful systems provide accurate status data, remote diagnostics, payment security, and clear maintenance alerts. However, data quality varies between markets, so rankings should explain their testing methods and evidence sources.
Field experience adds another layer. Technicians can assess installation time, cabinet accessibility, spare-parts availability, and repair training. Operators should compare warranty response, network reliability, energy efficiency, and total ownership costs over several years. A low purchase price may hide expensive cooling systems or frequent component replacement. No ranking is perfectly neutral. Weather, grid capacity, traffic patterns, and local regulations can change the results. A fair methodology should publish scoring weights, test dates, sample sizes, and known limitations. Numbers can mislead. Real operating evidence remains essential.
| Rank | Anonymous Manufacturer Profile | Primary Operating Region | Maximum DC Output | Typical Station Configuration | Supported Charging Standards | Network & Protocol Capability | Safety & Environmental Rating | Global Deployment Indicator | Service & Support Coverage | Overall Score |
|---|---|---|---|---|---|---|---|---|---|---|
| 1 | Manufacturer Profile 01 | Europe and North America | 350–640 kW | Modular cabinet with 2–4 dispensers | CCS1, CCS2, CHAdeMO; selected NACS compatibility | OCPP 1.6J and OCPP 2.0.1; remote monitoring | CE, UL-aligned designs, IP55 or higher | Projects documented in 50+ countries | Regional field-service partners and spare-parts programs | 94/100 |
| 2 | Manufacturer Profile 02 | East Asia and global markets | 180–480 kW | Standalone and split-power systems | CCS1, CCS2, CHAdeMO, GB/T | OCPP 1.6J; API integration and load management | CE, TÜV-related testing, IP54–IP55 | Commercial installations across 40+ countries | Distributor-led support with factory escalation | 92/100 |
| 3 | Manufacturer Profile 03 | North America and Europe | 150–400 kW | High-power cabinet with dynamic power sharing | CCS1, CCS2, NACS-ready configurations | OCPP 1.6J; cloud diagnostics and payment integration | UL, FCC-related compliance, NEMA 3R or equivalent | Public and fleet deployments in 30+ countries | 24/7 remote support and contracted on-site response | 90/100 |
| 4 | Manufacturer Profile 04 | Europe and the Middle East | 120–360 kW | Compact high-power unit with 1–2 connectors | CCS2 and CHAdeMO; selected AC integration | OCPP 1.6J and fleet-management APIs | CE, IEC 61851-oriented designs, IP54–IP55 | Deployments reported in 25+ countries | Certified installers and regional maintenance contracts | 88/100 |
| 5 | Manufacturer Profile 05 | East Asia and Southeast Asia | 60–240 kW | Wall-mounted, pedestal, and cabinet-based models | CCS2, CHAdeMO, GB/T | OCPP 1.6J; 4G, Ethernet, Wi-Fi, and RFID options | CE, IEC-based testing, IP54 | Export activity across 20+ countries | Factory warranty with distributor service network | 85/100 |
| 6 | Manufacturer Profile 06 | North America | 62.5–350 kW | Fleet-focused pedestal and modular systems | CCS1 and NACS; selected CCS2 availability | OCPP support, energy-management integration, remote uptime tracking | UL-listed configurations, NEMA 3R or higher | Fleet and public-sector projects in 15+ countries | Domestic field service and authorized technicians | 84/100 |
| 7 | Manufacturer Profile 07 | Europe | 50–300 kW | Urban fast charger and highway charging systems | CCS2 and CHAdeMO | OCPP 1.6J; backend, roaming, and smart-charging support | CE, IEC 61851-oriented designs, IP55 options | Installations across 15+ European markets | Local service contracts and preventive maintenance | 82/100 |
| 8 | Manufacturer Profile 08 | China and international markets | 60–480 kW | Liquid-cooled and air-cooled high-power platforms | CCS1, CCS2, CHAdeMO, GB/T | OCPP 1.6J; cloud platform, RFID, and payment interfaces | CE, GB/T-related compliance, IP54–IP55 | Export projects in 20+ countries | OEM, distributor, and remote technical support models | 81/100 |
| 9 | Manufacturer Profile 09 | Europe and Latin America | 50–240 kW | Modular public-charging and depot-charging units | CCS2 and CHAdeMO | OCPP 1.6J; roaming and charging-management integration | CE, IEC-based designs, IP54 | Regional deployments in 10+ countries | Partner-based installation and maintenance coverage | 78/100 |
| 10 | Manufacturer Profile 10 | Asia-Pacific | 30–180 kW | Compact DC chargers for urban and commercial sites | CCS2, CHAdeMO, and selected GB/T models | OCPP 1.6J; basic cloud monitoring and access control | CE or regional equivalents, IP54 | Projects documented in 10+ countries | Distributor support with standard warranty coverage | 75/100 |
The global DC fast-charging market is developing unevenly across regions. In China, dense urban demand supports large charging networks and high-power equipment. Manufacturers compete through cabinet efficiency, charging speed, and remote maintenance. However, busy stations can still face grid congestion during evening peaks.
Europe is expanding along motorways, city corridors, and cross-border freight routes. Equipment makers must manage different site conditions, payment systems, and grid connections. Cold climates also test cable flexibility and battery performance. A technically strong charger may underperform when installation planning is weak.
North America is growing through highway corridors and fleet depots. Larger vehicles require reliable power sharing between several charging bays. In the Middle East, high temperatures make thermal control and dust protection important. Southeast Asia shows strong potential, but land costs and uneven grid capacity slow deployment. Latin America often needs practical, lower-maintenance solutions for long-distance routes.
The leading ten manufacturers are not competing in one identical market. Their strengths differ by region, service network, software capability, and local partnerships. Field operators often value uptime more than peak output. That lesson is easy to overlook. A charger rated at extreme power is less useful when spare parts arrive late or technicians lack training. Regional standards are improving, yet interoperability remains imperfect. The market is advancing, but infrastructure quality still depends on careful local execution.
Public charging points by major region, 2023, approximate figures. China represented the largest public charging infrastructure base, while Europe and the United States continued expanding their high-power charging networks.
Source: International Energy Agency, Global EV Outlook 2024; regional totals are rounded estimates and include public charging points across charging-speed categories.
The leading ten manufacturers differ more in execution than appearance. This comparison reviews charging power, thermal design, software integration, service coverage, and field reliability. The International Energy Agency reported more than four million public charging points worldwide in 2023, with fast-charging deployment expanding rapidly. That growth exposes weak maintenance systems quickly. Field reality matters.
The first group includes high-power specialists offering 150–350 kW cabinets, liquid-cooled cables, and modular power blocks. Utility-oriented manufacturers focus on grid balancing, while transport-focused suppliers design rugged systems for buses and heavy vehicles.
Other leading profiles emphasize compact urban chargers, open communication protocols, payment security, or depot management software. The U.S. Department of Energy’s Alternative Fuels Data Center shows that charging availability and uptime remain important deployment measures, not optional features. Hardware alone is insufficient.
Several manufacturers support dynamic load management, remote diagnostics, and multilingual interfaces. These functions reduce unnecessary site visits and help operators identify connector faults before drivers arrive.
However, advertised peak output can be misleading. Actual performance depends on battery temperature, cabinet sharing, grid capacity, and cable condition.
Reports from the IEA and the National Renewable Energy Laboratory also indicate that charging demand will become more concentrated along highways and in dense urban areas. The ranking is not perfect. Regional service quality can change the result, and public uptime data remains inconsistent.
The global top ten should not be judged by charging speed alone. The IEA reported more than four million public charging points worldwide in 2023, with public infrastructure growing by about 40%. High-output manufacturers now offer 150–350 kW systems, liquid-cooled cables, and modular power cabinets. These features reduce charging time, but they also increase cooling, grid, and maintenance demands.
Network reach reveals a different performance gap. Some manufacturers operate across several continents, while others focus on regional utilities, highways, or commercial fleets. The IEA notes that fast chargers remain essential for long-distance travel, especially where home charging is limited. In practical site reviews, uptime, payment compatibility, spare-part access, and remote diagnostics often matter more than peak output. A 350 kW charger is not useful when a damaged connector waits weeks for replacement.
Future competition will involve energy management, not only hardware. The International Renewable Energy Agency links charging growth with renewable integration, battery storage, and smarter electricity demand. Manufacturers are testing vehicle-to-grid functions, distributed charging, and software that balances several vehicles at one site. However, standards and grid connections remain uneven across markets. That weakness deserves attention. A recent charger may perform well in a laboratory, yet struggle beside a crowded highway during winter. Technology claims need longer field evidence, clearer reliability reporting, and more transparent measurements from independent studies.